WDT Campaign Statistics
Statistics for Candidates
at a level never before seen!
Voter Turnout
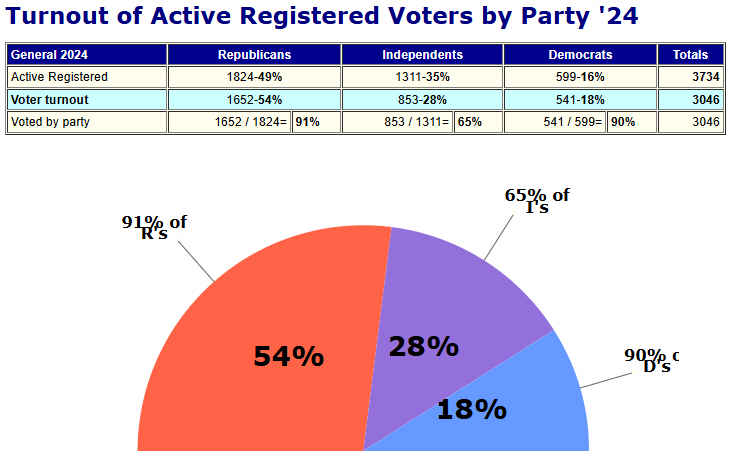
For the year you selected on the home page for generating these reports, this table and graph will show you the number of Active registered voters by party, the percentage of the total active registered by party, the voter turnout numbers and percentages of the total turnout and the percentage of those that turned out by party as compared to the total active voters for each party.
This will tell you if there is work that needs to be done to get higher percentages out to vote. In our example below, a 91% of all active Republicans turning out to vote is very good. But in a specific race, you will probably find those numbers to be significantly lower, especially in non-partisan and down ballot races.
Site Menu
- Home
- Create Statistics
- Gen Walklists
- Voter Lookup
- Precinct's Numbers
- Voter Turnout section
- Voter Rolls' Statistics
- Training Videos
- Testimonials
|
Nicholas St Jon© Church Trust c/o 280 Greg St. Suite 10 Reno, NV [89502] Cell: 775.772.6467 [email protected] |
 |